
July 23, 2026
By Braden Eberhard
As the 2026 regular season comes to a close its time to take a look at the players with the best performances. Sometimes MVP conversations are all but forgone conclusions, sometimes its a fight to end. This year, we have two top contenders putting in all-time performances at the top of their games.
Alex Atkins (New York Empire, 10-2, 2nd in the East) leads the entire UFA in total aEC, 73.7, on the back of elite thrower efficiency and the fewest turnovers of any candidate in this conversation. Tobe Decraene (Boston Glory, 11-1, 1st in the East) sits right behind him at 71.0, built almost entirely differently, more touches, more turnovers, and box-score numbers, goals, assists, hockey assists, that dwarf Atkins’s. We’ll also mention three others who have real, specific cases in Elliot Hawkins, Chad Yorgason, and Kyle Henke. We’ll see how the playoffs shake out but barring an insane showing, we’d be surprised to see someone besides Atkins or Decraene hoisting the trophy in Madison.
A quick glossary. aEC values a player’s throws and catches by how much they actually moved their team’s chances of scoring. Thrower aEC and Receiver aEC split that value by role. LC (Lag Contribution) is the value a player adds to a possession beyond his own direct touches, credit for what his presence creates elsewhere on the field. Think of it similar to hockey yardage. PI-P (Impact per Possession) is a rate version of aEC, scaled to a player’s actual playing time rather than his raw season total. A percent of how much of that teams value is generate by that one player. CPOE measures thrower accuracy relative to how hard the throws attempted actually are. xCP is the expected completion probability of the throws a player actually attempts, a proxy for how much risk he’s taking on.
Alex Atkins: Premier Thrower
Atkins’s case starts with a combination nobody else in the league is pulling off simultaneously.
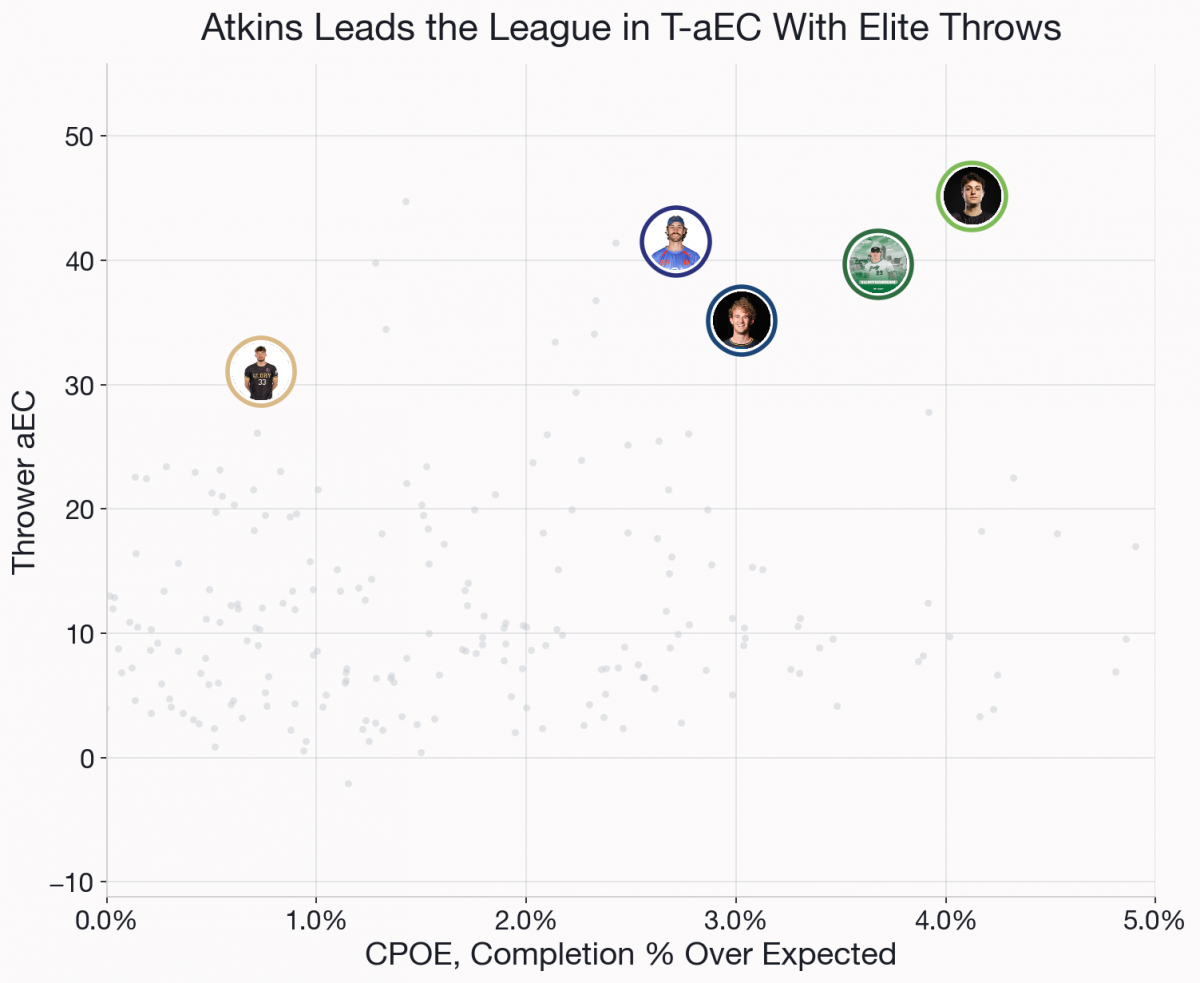
Thrower aEC (45.1) rewards volume and value; CPOE (+4.1 percent) rewards accuracy relative to shot selection difficulty. Atkins really jumps out on both sides. Plot every qualifying passer in the league this season for context (players with at least 50 completions) and the pattern holds leaguewide too, nobody comes close to matching his combination. The nearest cluster of comparable throwers sits a full tier below him on thrower aEC. He’s pairing it with the lowest turnover rate in the group, 1.08 per game, less than Kyle Henke’s (1.58), the next-best mark, and well under half of Tobe Decraene’s (2.50).
What makes this a story and not just a good season is what it looked like before this year. From 2022 through 2025, playing for Colorado, Atkins’s CPOE and turnover rate both got steadily worse, every single season, CPOE from +3.4 percent down to a career-worst -2.1 percent in 2025, turnovers from 1.25 per game up to a career-worst 3.75. Then, switching to a new team in 2026, both completely reverse to career bests simultaneously, +4.1 percent CPOE, 1.08 turnovers per game, and a thrower aEC (45.1) well above his previous career high (33.7, set in 2024). This is the best year of his career by a wide margin.
Clearly, that ‘new team’ isn’t incidental to the story.
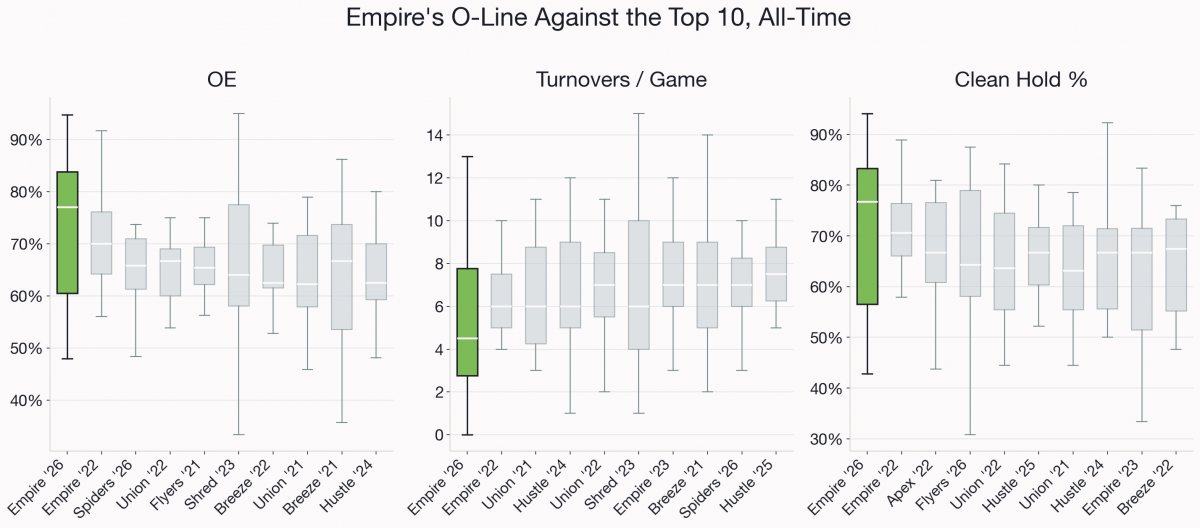
Empire’s O-line this season isn’t just good, on two of these three measures, it’s the best O-line this league has tracked, full stop. OE (70.7 percent) is the highest O-line offensive efficiency of any team-season in this dataset (2021-2026, 22 teams), edging out the previous number one, which happens to be Empire’s own 2022 team (69.6 percent). Turnovers per game (5.67) is the same story, the lowest O-line turnover rate ever recorded here, again just ahead of Empire’s 2022 squad (6.27). And clean hold percentage (70.1 percent) led the entire league in 2026 and is the 2nd-best clean-hold season on record, trailing only, once again, Empire’s own 2022 team (70.0 percent). The best offense ever constructed centered on Ryan Osgar, Ben Jagt and Jack Williams is back again, arguably better, with Atkins running it.
Tobe Decraene: The Best Player On The Best Team
If Atkins’s case is an efficiency combination, Decraene’s case is that he’s just always involved, and never as a weakness.
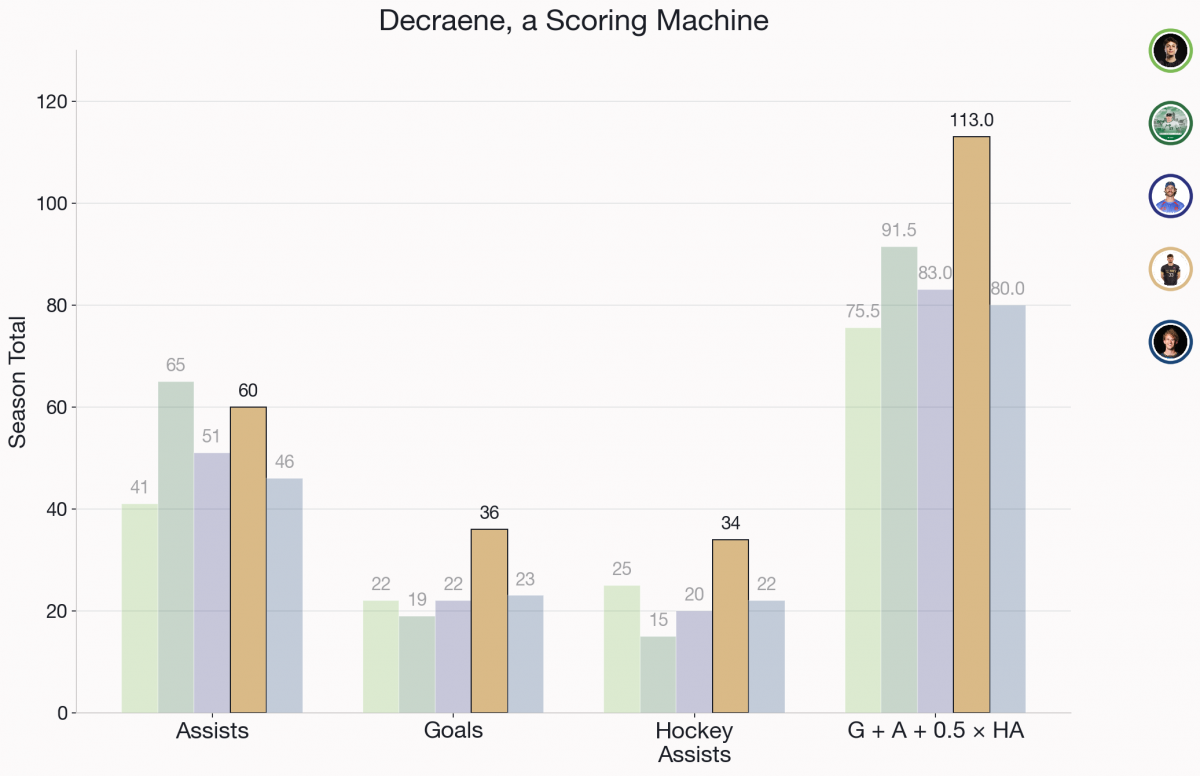
He isn’t an elite thrower by the numbers here. His CPOE (+0.7 percent) is the lowest of the five, and his thrower aEC (31.0) is the lowest too, well behind Atkins’s (45.1) and Henke’s (41.5). What he is instead is the player Glory’s offense runs through, at real volume, 516 throw attempts, second of the five behind only Henke’s 524, and it shows up in the counting stats regardless. Rank the five candidates against each other in goals, assists, and hockey assists, and Decraene is top-two in all three, number one in goals (36), number two in Assists (60), number one in Hockey Assists (34). He just manages to find the endzone, in whatever way is necessary.
Decraene is the only one of the five whose receiver aEC (40.0) exceeds his thrower aEC, 40.0 to 31.0. He isn’t running the offense by picking apart defenses with his arm. He’s running it by touching the disc constantly, in both directions, and finishing more of those touches than anyone else here. Not the sharpest tool in this group, but he gets it done. No matter what teams do, the disc ends up in his hands and then in the endzone.
Entering the playoffs, Tobe and the Glory sit at the top waiting for the winner of DC and New York. With what could be a clash of the titans ahead of us assuming the Empire hold out on Saturday, “best player on the best team” stops being a hypothetical for whoever comes out ahead.
Atkins Versus Decraene, Head To Head
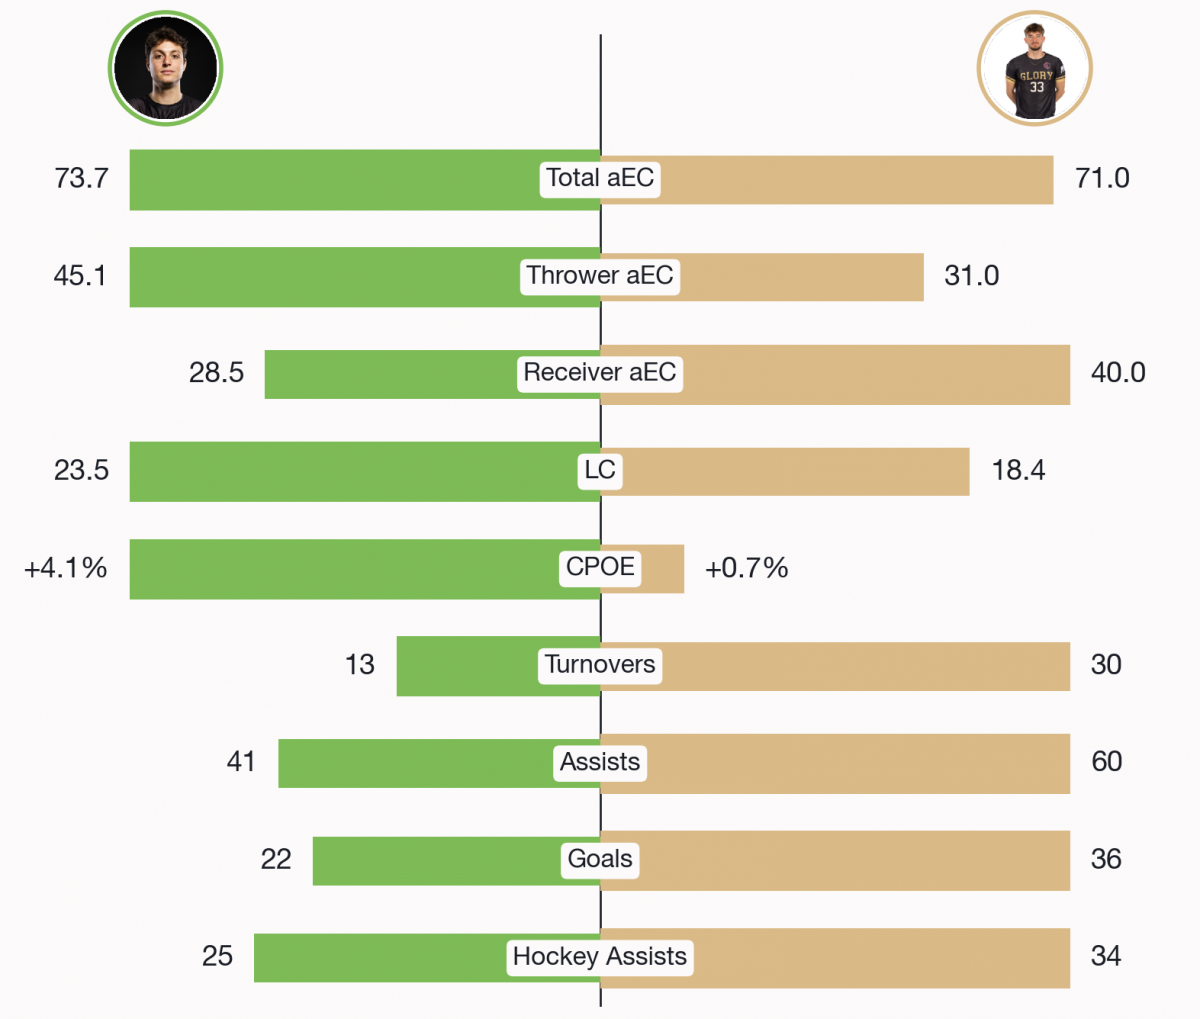
Atkins wins Thrower aEC by 14 points, Decraene wins Receiver aEC by 11, and it more or less goes like that down the list. Atkins’s CPOE is nearly 6x Decraene’s. Decraene has more than double Atkins’s turnovers, 30 to 13. Atkins leads in LC too, 23.5 to 18.4, which tracks with everything else about how he generates value, a lot of it shows up in plays he isn’t directly touching. Decraene answers with 19 more assists, 14 more goals, 9 more hockey assists, the parts of the box score that are easiest to point to and hardest to argue with. Somehow they still end up close, 73.7 to 71.0.
The Supporting Cases For MVP
Let’s mention three other players who have real, specific, verified cases, each anchored to a reason voters could mark them down for the vote although it would take some effort for them to break through.
Elliot Hawkins: The Highest Ceiling In The League
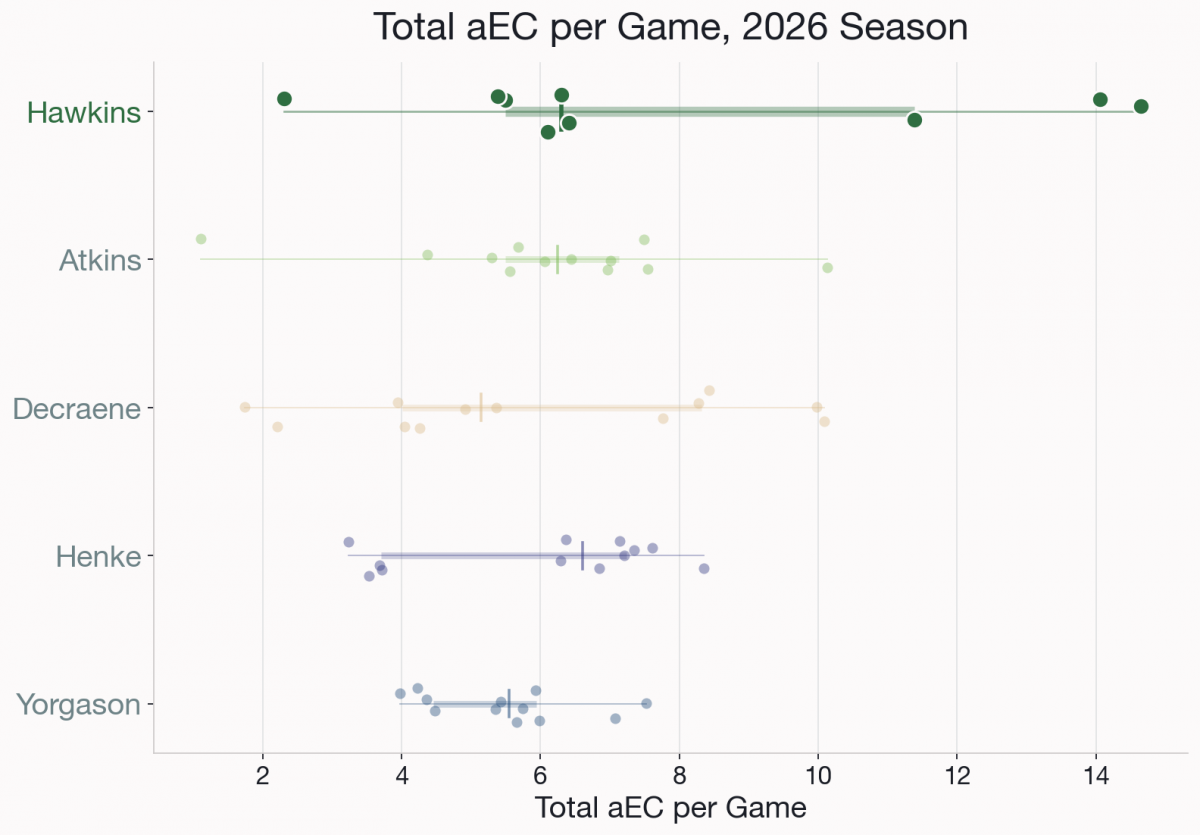
Hawkins’s two best games this season, 14.6 and 14.1 total aEC, aren’t just his best. Checked against every individual game in the modern stats era, 79,409 player-games across six seasons, they rank first and third all-time. Give all five candidates the exact same box-and-whisker treatment, no special pleading, and his box is visibly the widest of the five, by a clear margin.
It comes with real costs. He missed AlleyCats’ first two games of the season outright, plus one more mid-season, every number in his profile was compiled in nine games, not 12. His turnover rate (2.89 per game) is the highest of the five, and his team is 6-6. The mechanism is consistent with everything we’ve written about him before, the lowest xCP of the group (89.1 percent, meaning he takes the hardest throws) paired with the 2nd-highest huck attempt rate (16.1 percent).
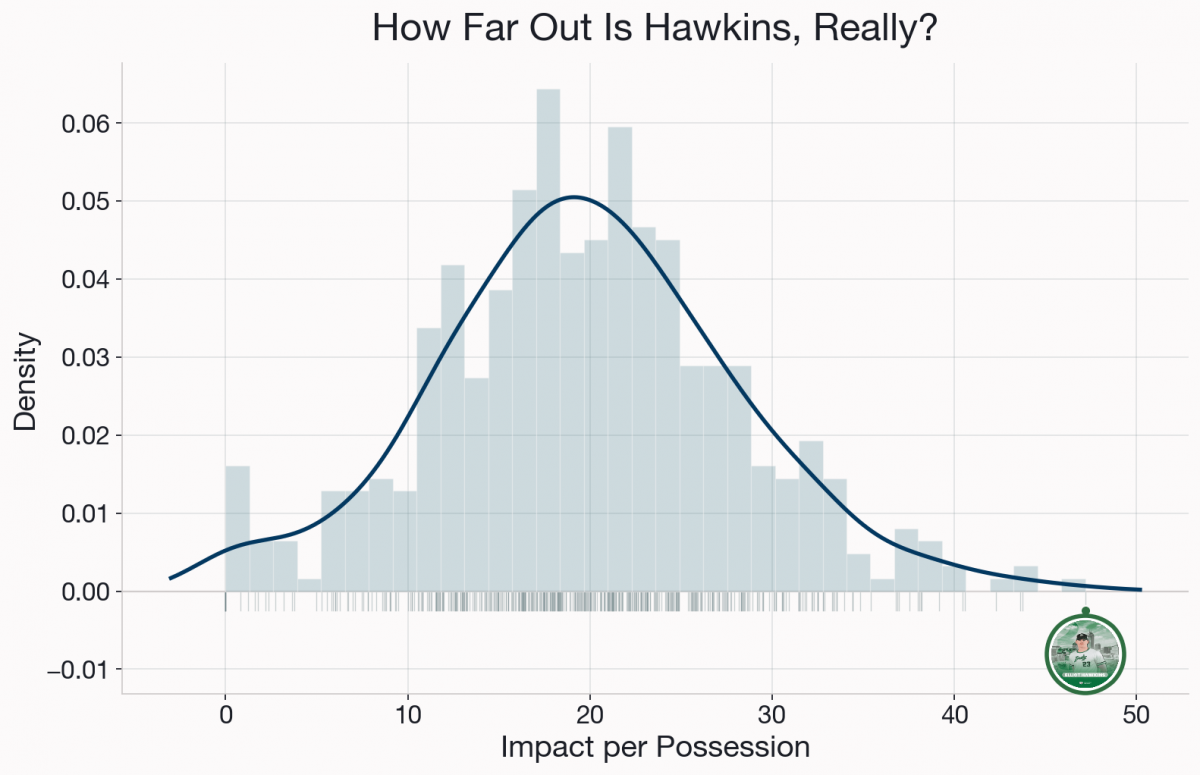
The clearest way to see how much AlleyCats actually depend on Hawkins is PI-P, the rate-based version of aEC that doesn’t care how many games a player got to play. His 47.2 isn’t just tops on his own team, it’s nearly 15 points clear of the next-closest AlleyCat (32.2), a far wider gap than what separates most teams’ best player from their second-best. It’s also the single most extreme value in the entire 474-player qualifying pool this season, 3.34 standard deviations above the mean, higher than anyone else at any position on any team. The huck attempt rate that usually gets the attention is real, 2.85 standard deviations above the league mean. PI-P is where Hawkins is actually alone, and it’s the clearest evidence that on a per-possession basis, no player in the league means more to his own team than Hawkins does to his.
Chad Yorgason: High Risk, High Reward
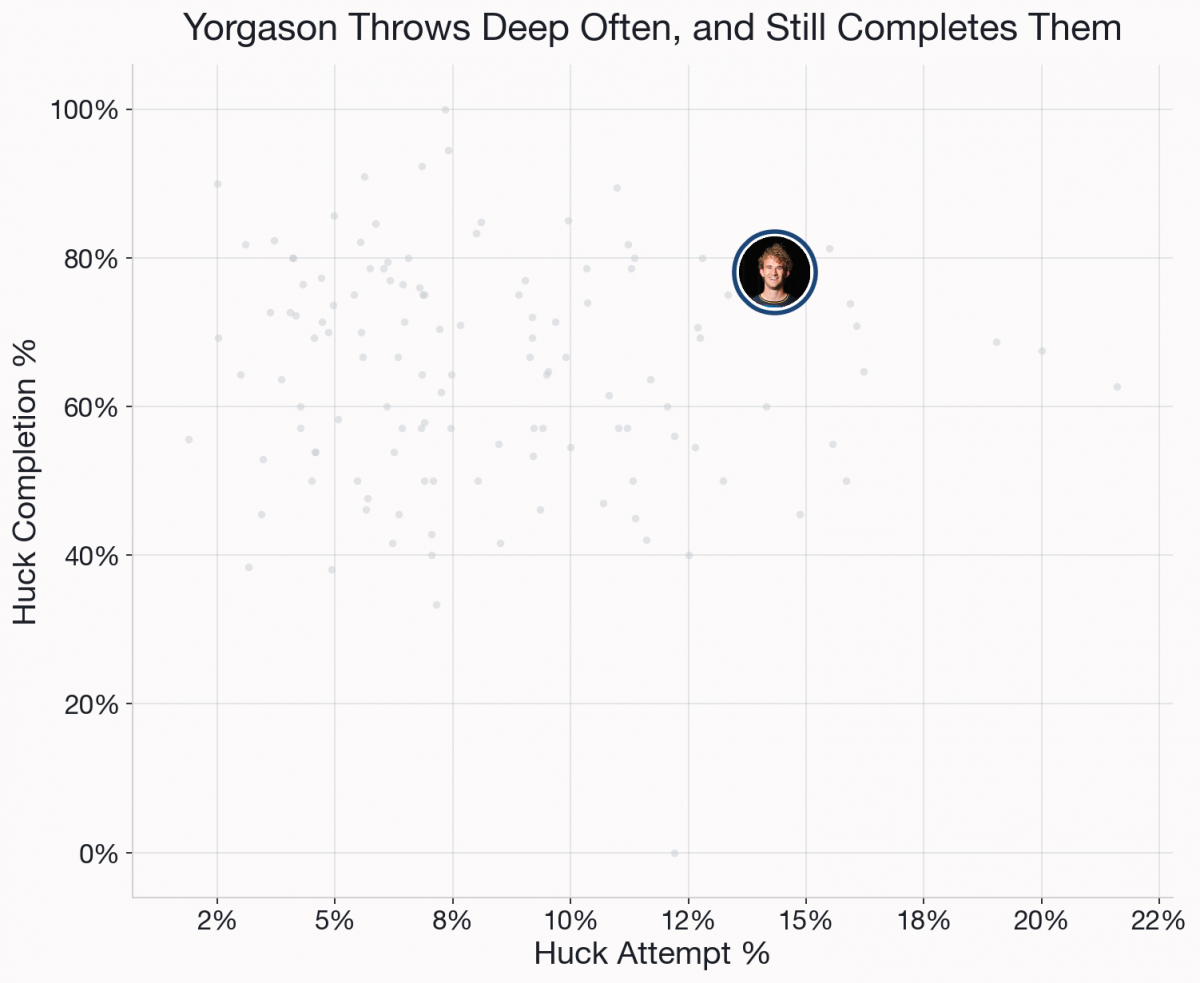
Yorgason plays an aggressive style without the part of aggressive play that normally costs you something. His huck attempt rate (14.3 percent) is the second-highest of the five, nearly matching Hawkins’s (16.1 percent), and his huck completion rate (78.0 percent) is closer to Atkins’s (84.8 percent) than to Hawkins’s (70.8 percent) or Decraene’s (69.2 percent). Zoom out to the full league for context (every qualifying player with at least 20 hucks thrown) and most high-volume deep throwers cluster below 75% completion. Yorgason throws deep as often as almost anyone in this group and simply doesn’t pay for it in accuracy the way the rest of that population does.
The same pattern holds in his overall game, not just the deep ball. On the exact same chart that makes Hawkins’s case above, Yorgason sits at the opposite end, not a lower ceiling, but no real floor at all. Among every 2026 player averaging at least as much total aEC per game as Yorgason (5.5), his per-game standard deviation (1.10) is the lowest by a wide margin, well under two-thirds of the next-closest player at that production level. His game-to-game range (3.54 total aEC, from a low of 3.98 to a high of 7.52) is barely a third of Hawkins’s and less than half of anyone else’s in this group. He plays aggressive, and he’s still the one candidate here who is essentially never bad, week after week despite his team’s rocky season at 5-7, third in the West.
Kyle Henke: Mr. Clutch
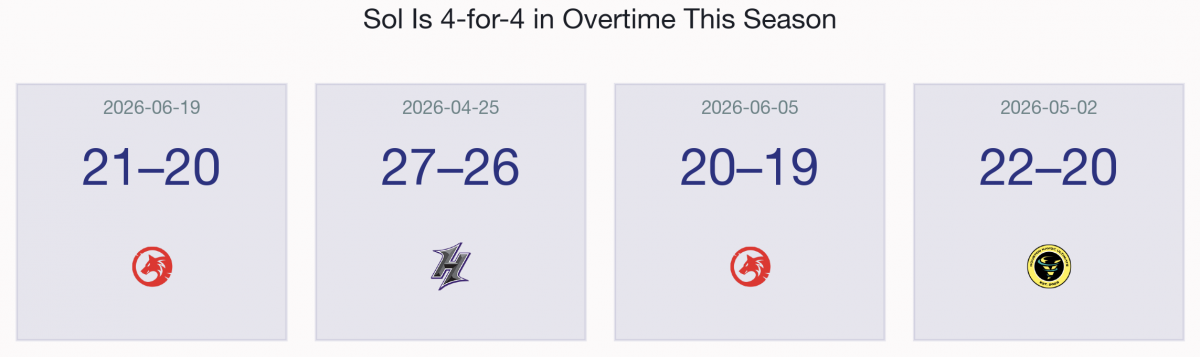
Four games this season reached overtime for Austin Sol. They won all four. Sol’s 11-1 is also the best record this franchise has posted in the tracked history of this dataset (2016-2026), and their first number one standing.
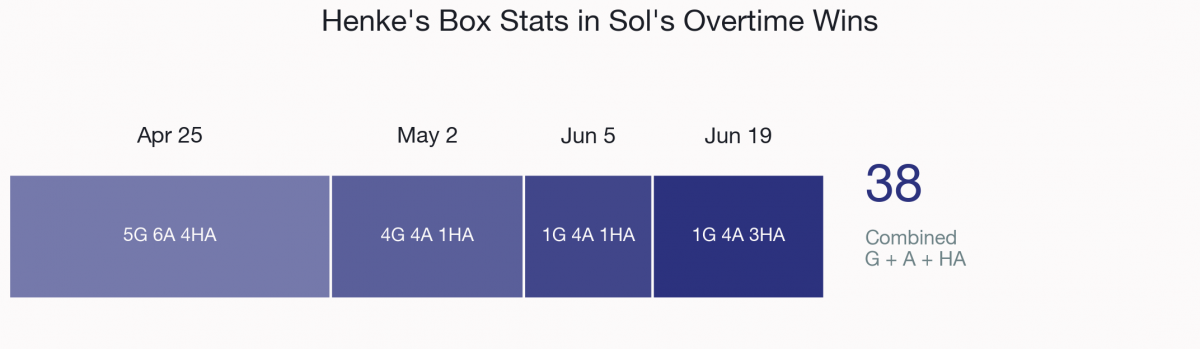
So far, Austin has been the team to outperform their expectations the most, largely on the back of Henke and the four overtime wins. Add up Henke’s own box score across exactly those four games and he put up 11 goals, 18 assists, and 9 hockey assists, 38 combined, while completing 168 of 176 throws, 95.5 percent. He didn’t dip below 91.9 percent completion in any of the four and has made his mark felt. While not perfect, Henke has been the most clutch of any of our MVP hopefuls.
The Full Picture
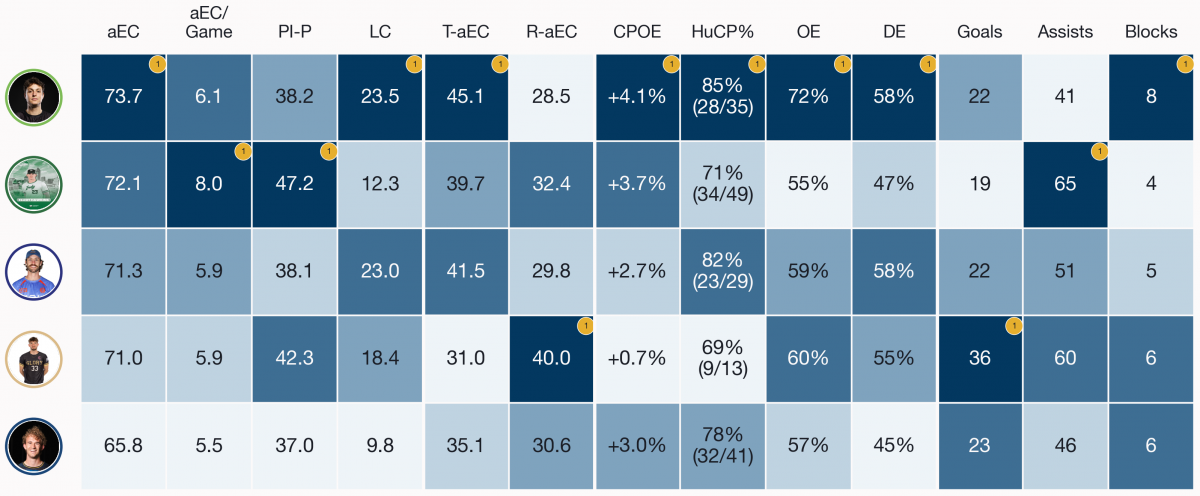
Atkins leads outright in eight of these thirteen columns, total aEC, LC, thrower aEC, CPOE, huck completion, OE, DE, and blocks, the efficiency case in full. Hawkins leads three, aEC per game, PI-P, and assists, the “does the most with what he’s given, in fewer opportunities” case. Decraene leads two, receiver aEC and goals, his specific mechanism. Henke and Yorgason don’t lead any single column here, consistent with their sections above, real, defensible cases built on one sharp fact apiece rather than a stat leaderboard.
So, Who Is The MVP?
Atkins’ case is efficiency and history, the league’s best total aEC, a career-best turnover rate, and an O-line now standing shoulder to shoulder with its own franchise’s best-ever unit. Decraene’s case is volume without the downside, not the sharpest thrower here, but the one with his hands on the disc more than anyone, on the team currently holding the better seed, with a possible division title still ahead of both of them. Choosing between them means choosing what you value more, and the data supports either answer.
Hawkins has the single strongest peak of anyone in six years of this dataset, and the clearest case that his own team leans on him more than any other team leans on its best player. Yorgason plays aggressive without the downside that usually comes with it, and does it every single week. Henke has the clutch record and the best season his franchise has ever had. All three are legitimate secondary cases, without unseating the two players at the top.
All eyes will be tuned in this weekend and for the divisional champs as the final chapters of this race unfold.
About Shown Space:
Shown Space is an analytics platform focused on bringing more depth and precision to ultimate frisbee. We combine data, modeling, and intuitive presentation to surface the patterns and choices that influence outcomes. If you want to learn more, you can visit shownspace.com, read more at the Shown Space Substack, or find the original Sloan paper, “A Machine Learning Approach to Throw Value Estimation in Professional Ultimate Frisbee”