


June 23, 2026
By Braden Eberhard
How advanced stats let us look inside the way UFA handlers perform and what they reveal about each player's role.
Advanced statistics have changed the way we understand individual performance in team sports. We've been looking deeper into ultimate at Shown Space to try and answer deeper questions. Today we're going beyond assists and completions to ask a deeper question. How is a thrower actually contributing to their team?
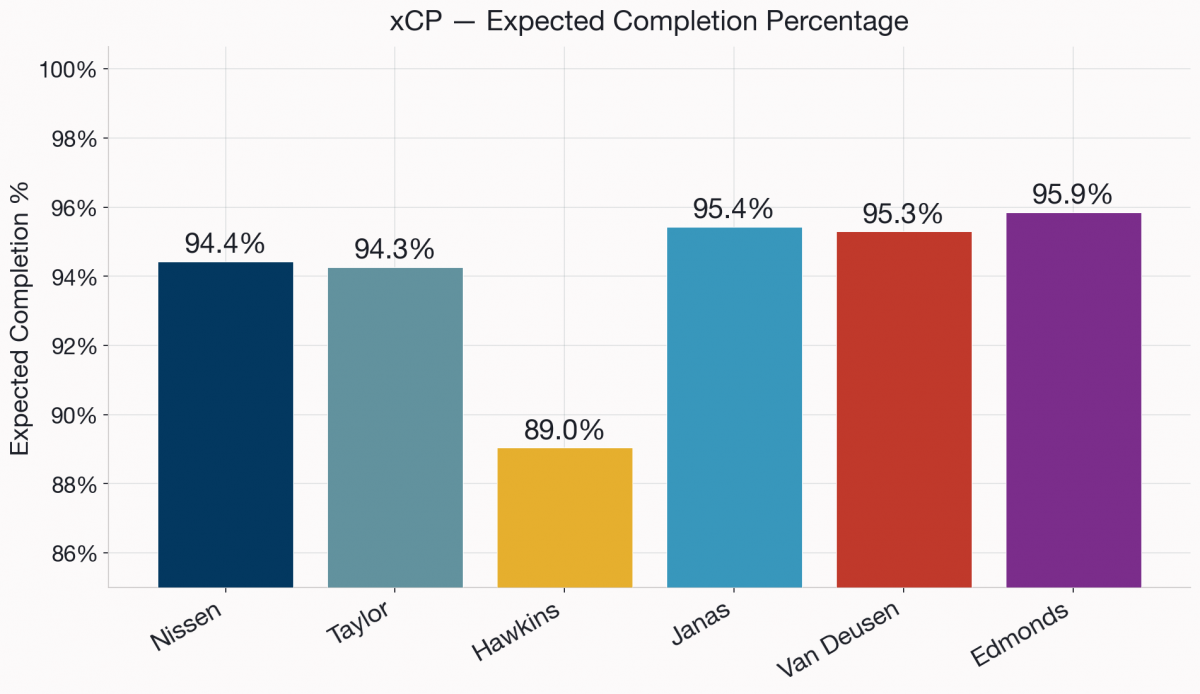
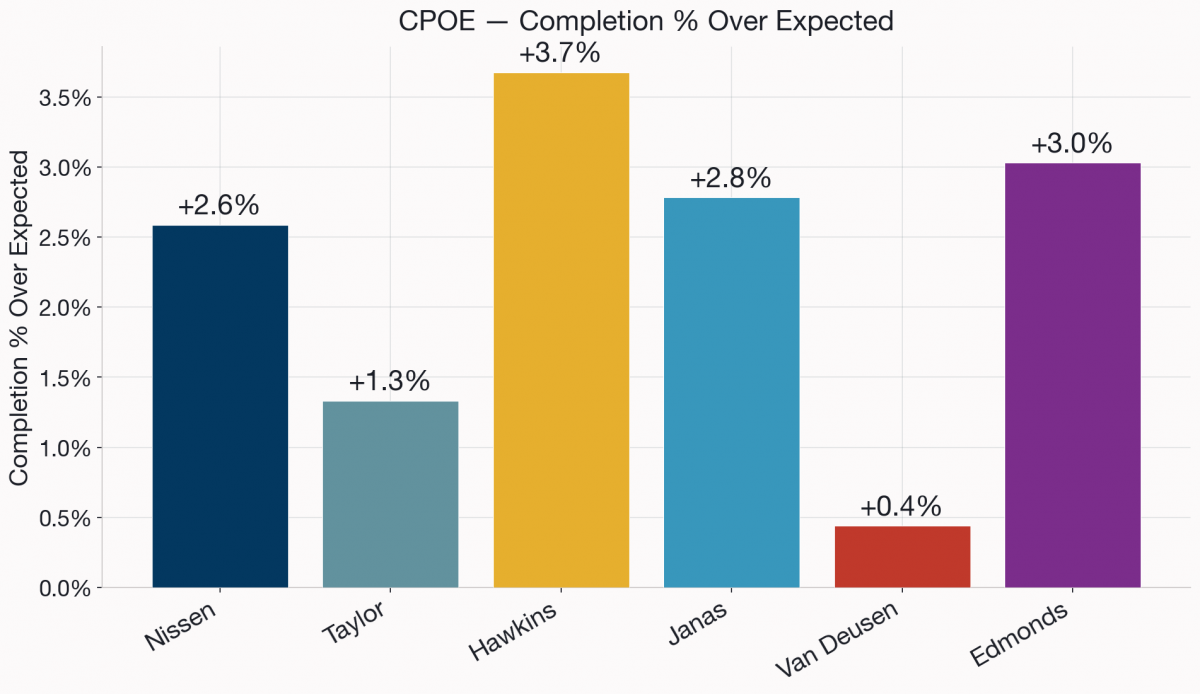
We start with Thrower aEC (adjusted Expected Contribution), an aggregate of the total value in terms of scores a thrower brings. We compliment this with other numbers including LC (Lag Contribution) which tells us how effectively a player sets up their teammates, xCP (expected Completion Probability) or the general risk level of a thrower, and CPOE (Completion Probability Over Expected) or how well a thrower performs compared to the average player making those same throws. Together, they let us build a more precise picture of a player's role and style, not just their output.
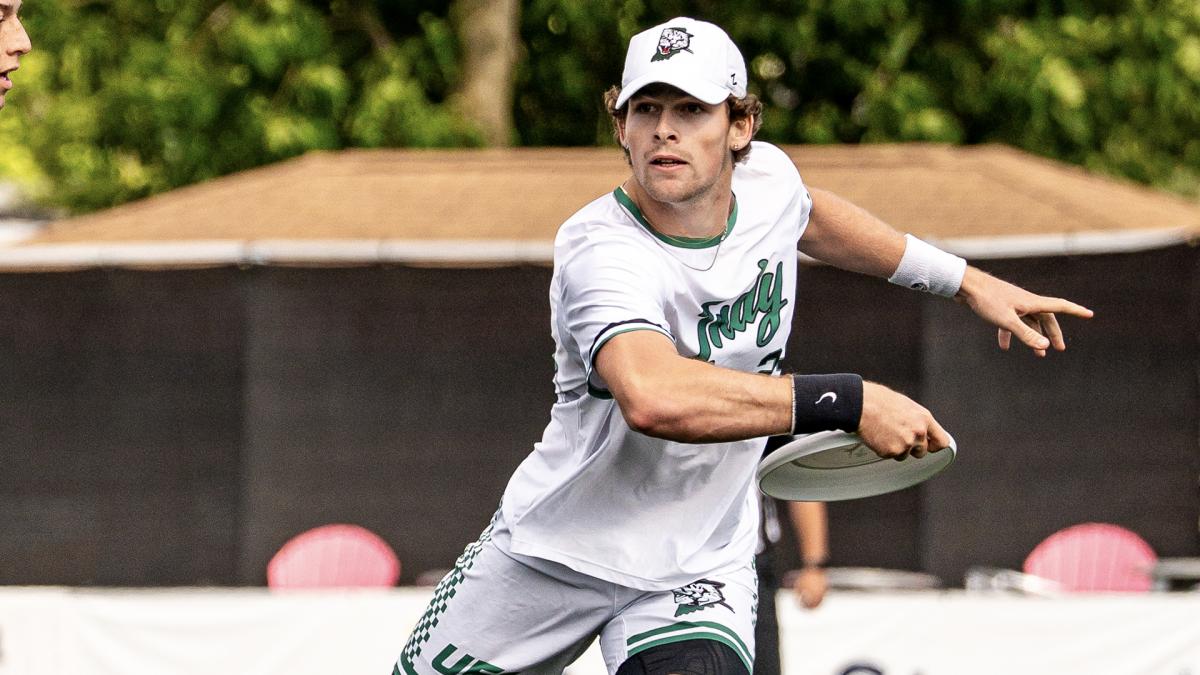
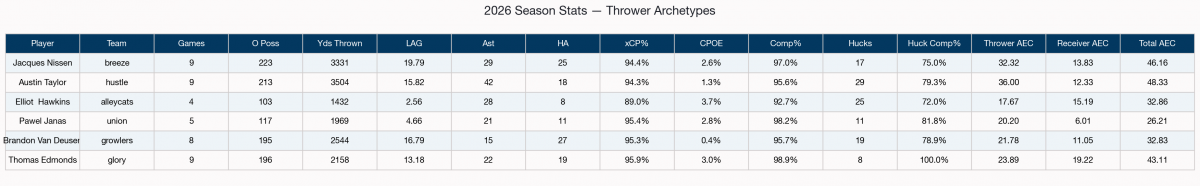
We're going to look into 6 elite throwers: Jacques Nissen (Breeze), Austin Taylor (Hustle), Elliot Hawkins (AlleyCats), Pawel Janas (Union), Brandon Van Deusen (Growlers), and Thomas Edmonds (Glory). On the surface they're all elite offensive throwers. Digging deeper we can illuminate how they're each doing almost completely different jobs.
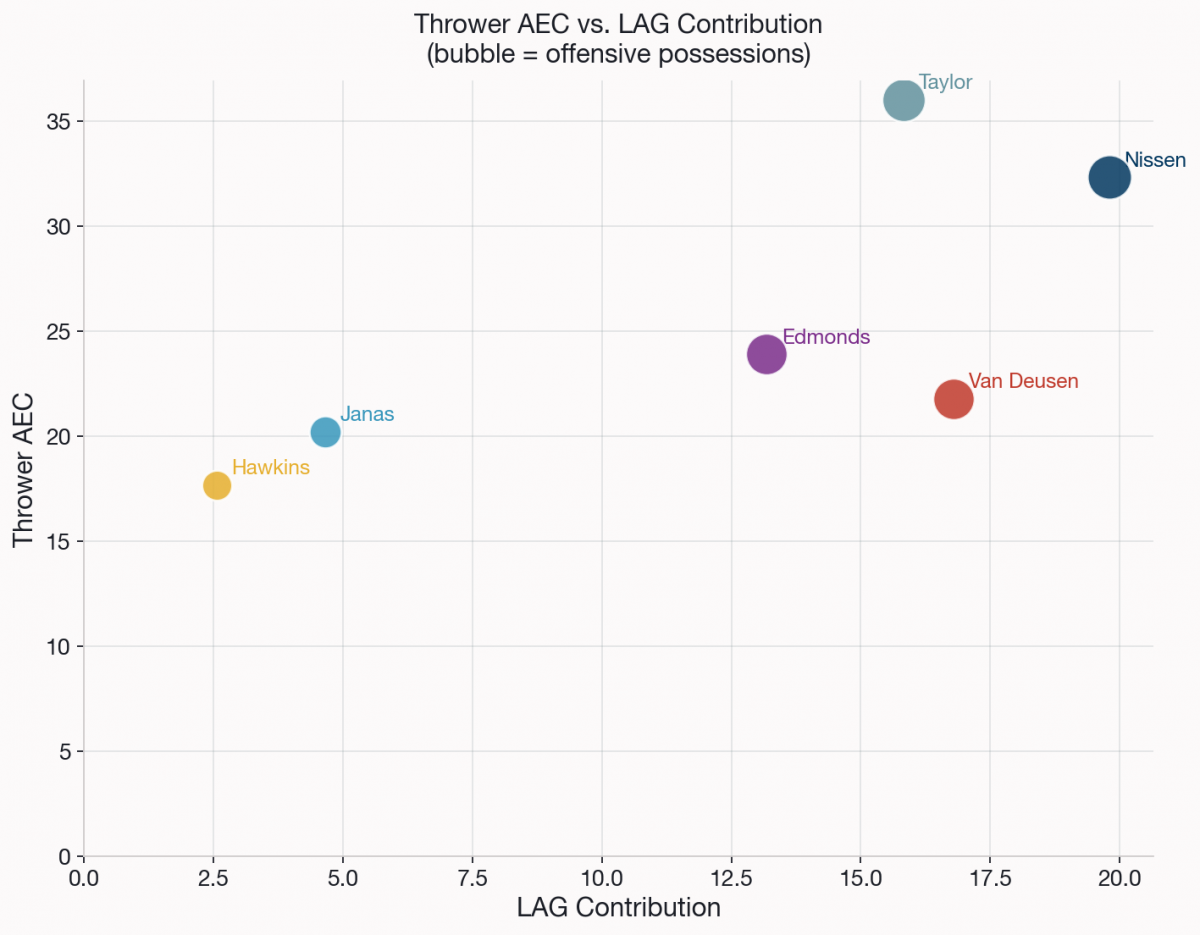
LC and aEC: Moving the Disc vs. Creating Value
Let's start with a comparison of direct and indirect contribution. Nissen leads LC outright at 19.79 reflecting his role not just as an engine but also a facilitator. His nearly even split of 29 assists and 25 hockey assists means he's finishing drives and setting them up in similar measure.
Van Deusen (16.70 LC), Taylor (15.82), and Edmonds (15.68) form a close second tier. Janas (2.51) and Hawkins (2.81) trail significantly but Thrower aEC per 100 possessions tells Where these two both make their mark. Janas (18.66) and Hawkins (16.50) lead the per-possession rate, joined by Taylor (16.90). Low LC with high Thrower aEC means they're generating elite value per touch, even when those touches don't produce long chains.
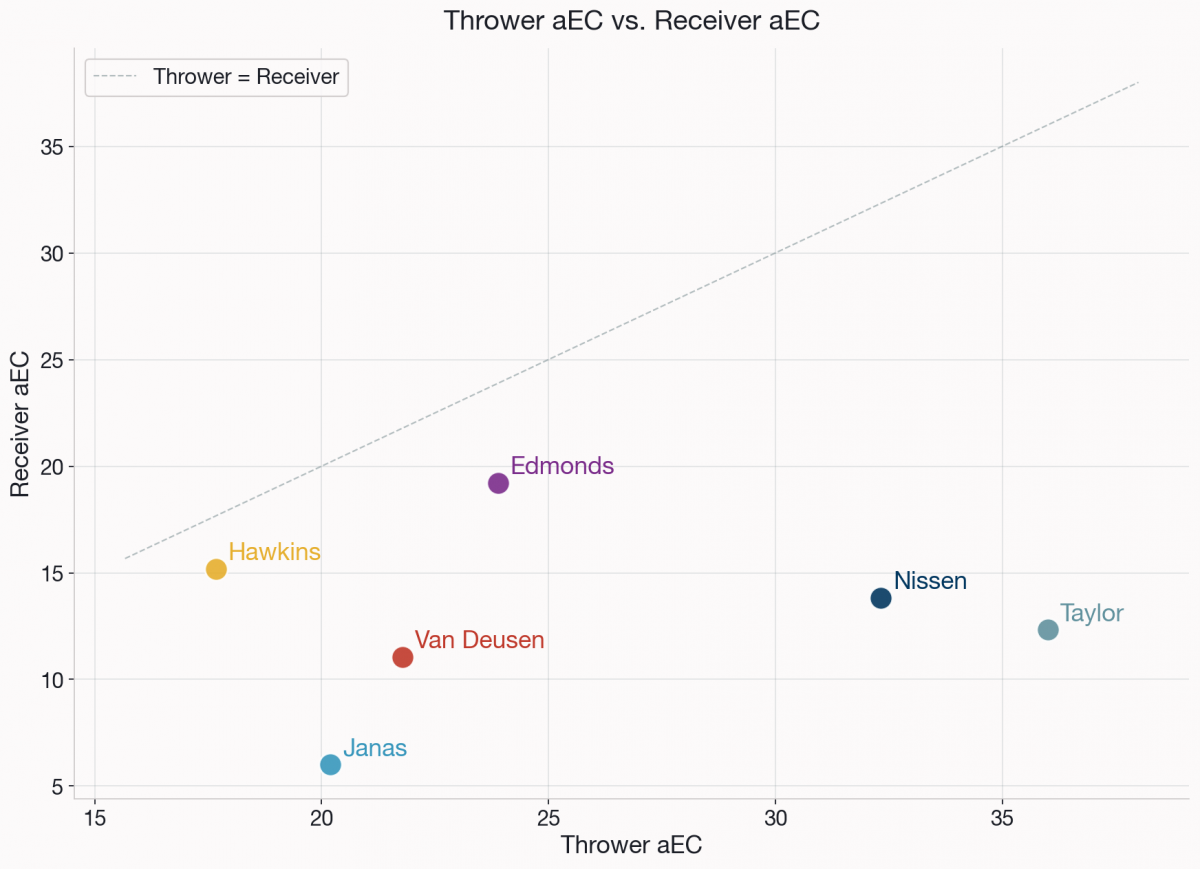
Both Edmonds and Hawkins land close to the Thrower=Receiver diagonal contributing meaningful value on both sides of the disc. Edmonds sits at 23.82 Thrower aEC and 19.04 Receiver aEC. Hawkins is similarly balanced despite his aggressive throwing identity, because the Alleycats are actively deploying him as a deep receiving target as well.
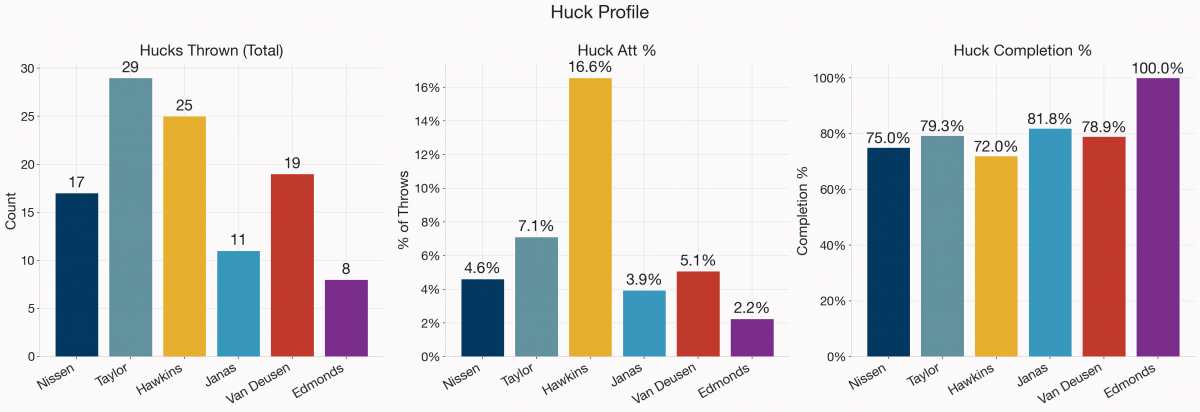
Huck Profile
Hawkins: The Pure Shooter
Hawkins plays a style unlike anyone else in this group.
His xCP of 89.0 percent is the lowest in the group by more than five points; everyone else sits between 94-96%. That gap isn't necessarily a flaw in his game and instead reflection of the throws he's choosing. Huck Att % of 16.6 percent, more than twice Taylor (7.1 percent) the next most aggressive, means roughly one in six of his throws is a deep shot. He averages 3.25 turnovers per game, more than any player in this group, and his 92.7 percent overall completion rate and 72.0 percent huck completion are the group's lowest.
His CPOE of +3.67 percent is the group's best. He is consistently outperforming the model's expectations for the throws he's actually attempting. The incompletions aren't all bad decisions but the built-in cost of attacking windows that most handlers don't attempt.
His directional charts lock in the picture. The throwing chart shows a good concentration in a forward cone. The receiving chart mirrors it with a massive above-average presence in the deep window. The Alleycats have built a downfield-attack identity through Hawkins on both ends simultaneously.

Edmonds: The Balanced Passer
Edmonds is the cleanest thrower in the group by efficiency measure with a 98.9 percent completion rate, 3.1 turnovers per 100 possessions and 100 percent huck completion on 8 attempts, all group bests. His huck attempt rate is the lowest in the group at 2.2 percent and he's converting every one.
That's elite decision-making at the most selective end of the spectrum. His radar charts are the most balanced as well with few significant tendencies apart from finding himself behind the disc on the backhand side. His 22 assists against 19 hockey assists confirms he finishes drives and sets them up in near-equal measure, similar to Nissen.

Janas: The Backfield Anchor
Janas reaches an efficiency similar to Edmonds's with 98.2 percent completion and +2.78 percent CPOE but through a fundamentally different role. His directional chart is weighted toward the lateral and backward swing windows with below-average forward volume. His 18.66 Thrower aEC per 100 is the group's highest rate, generated in a constrained role that limits his touches to specific situations. Compared to Hawkins or Edmonds, his role is much more specialized and specific but he still is able to fill it effectively.

Van Deusen: The Full Field Visionary
Van Deusen is a possession handler in the truest sense, and his directional charts make that identity visible. Both his throwing and receiving charts are dominated by lateral windows. He's moving the disc sideways at above-average rates and being thrown to sideways in return. That spatial profile maps directly to his function on offense: keeping the disc alive, recycling possession, and setting up the next attack rather than initiating it himself.
His season numbers tell the same story. With 15 assists against 27 hockey assists Van Deusen is generating scores for teammates far more often than finishing them himself. His 16.70 LC reflects how much raw disc movement he's responsible for, and his 8.56 LC per 100 confirms the pace. His CPOE of +0.4 percent is the group's lowest but still positive, executing above expectation while operating closer to the baseline by design.

Taylor: The Pure Pocket Passer
Taylor epitomizes what it means to be a pure handler. His receiving chart is concentrated in the backward windows where he's catching resets and continuation passes behind the disc, and from there he generates enormous value with his throws. His 42 assists against just 18 hockey assists is the starkest finishing profile in the group at 5.00 assists per game. His 7.1 percent huck attempt percentage with 79.3 percent huck completion puts him second in accuracy among the group's deep shooters.
His CPOE of +1.3 percent is below most of the group, reflecting a role built on volume across the full field rather than hunting a small number of premium looks.

Nissen: The Mobile Tactician
Nissen's directional charts have no single dramatic bias with above-average presence across a broad forward window and several lateral zones. That spatial balance is the visual signature of a handler who can contribute from anywhere on the field. His 29 assists and 25 hockey assists, nearly even, confirm a player who finishes drives or sets them up depending on what the defense gives. His 19.79 LC leads the group at 8.88 per 100 possessions.

The Full Picture
The numbers across these six players tell six different stories. Hawkins's xCP sits nearly seven points below anyone else in the group, and his CPOE leads it. Edmonds and Janas reach similar efficiency from the opposite direction, with high xCP, near-perfect completion, and almost no hucks. Taylor's assist total dwarfs his hockey assists while Van Deusen's is nearly inverted. Even in a single table, the archetypes are hard to miss.
What the Stats Tell Us
Advanced stats don't flatten handlers into a single ranking but reveal the specific way each player creates value. Hawkins and Edmonds sit at opposite poles of huck frequency, risk profile, and xCP yet both outperform expectations. Janas and Van Deusen both operate in possession-first roles but one is generating elite per-touch aEC from a swing window while the other is churning through lateral touches to keep the disc moving. Taylor's pure handler identity shows up in his backward receiving chart and his outsized assist volume. Nissen's breadth shows up in the absence of any dramatic bias at all.
The point isn't that these players are different levels of good. They're playing different games, and the right combination of LC, aEC, xCP, CPOE, hucking, and directionality charts lets you describe each one.
About Shown Space:
Shown Space is an analytics platform focused on bringing more depth and precision to ultimate frisbee. We combine data, modeling, and intuitive presentation to surface the patterns and choices that influence outcomes. If you want to learn more, you can visit shownspace.com, read more at the Shown Space Substack, or find the original Sloan paper, “A Machine Learning Approach to Throw Value Estimation in Professional Ultimate Frisbee”
